Insurance Risk Application Of The Time Engine
Adaptive Capacity Measurement for Insurance and Reinsurance Systems
Chris Olson
Founder & CEO Time Engine Technologies LLC
Version 1.0 — June 2026
A Temporal Framework for Detecting Compression, Intervention Windows, and Capital Allocation Risk
Abstract
Traditional insurance analytics evaluate loss probability, capital adequacy, reserve development, historical performance, and pricing adequacy. These tools are essential, but they often measure deterioration after a system has already begun losing the capacity to respond.
Time Engine Technologies introduces a different measurement layer.
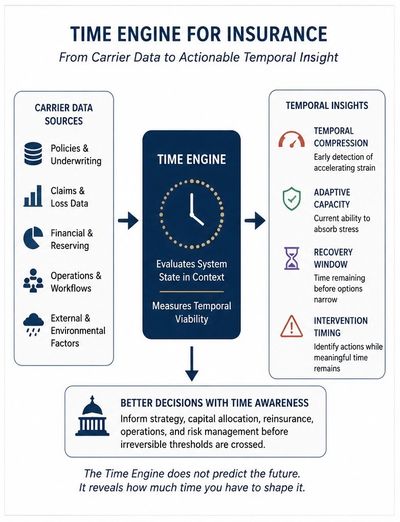
The Time Engine evaluates insurance carriers as complex operating systems. Rather than asking only what happened or what is likely to happen, it measures whether the carrier retains enough adaptive capacity to absorb stress, correct course, and avoid entering a compressed operating state.
This paper outlines a variable architecture for applying Time Engine to insurance and reinsurance systems. The framework organizes existing carrier telemetry into system-level categories that reflect energy input, energy loss, growth phase, complexity load, operational velocity, and external pressure. These variables allow Time Engine to evaluate whether a carrier is expanding, stabilizing, compressing, or approaching a point where intervention becomes materially less effective.
The central question is not simply whether risk is priced.
The central question is:
Is the system still recoverable, and how much usable time remains to change the outcome?
1. The Blind Spot in Insurance Risk Evaluation
Insurance organizations are commonly evaluated through financial, actuarial, and operational indicators, including:
- Combined ratio
- Premium growth
- Loss ratio
- Expense ratio
- Reserve adequacy
- Capital and surplus position
- Financial rating
- Reinsurance cost
- Claims severity
- Claims frequency
- Loss development patterns
These indicators are important, but many are trailing or lagging indicators. They often confirm deterioration after operating conditions have already changed.
A carrier can appear financially healthy while its internal system is consuming adaptive capacity.
A carrier can maintain capital strength while losing operational maneuverability.
A carrier can remain profitable while becoming less recoverable.
This is the blind spot Time Engine is designed to detect.
Traditional analytics ask:
What happened?
Predictive analytics ask:
What is likely to happen?
Time Engine asks:
How much adaptive capacity remains, and how quickly is that capacity being consumed?
2. The Insurance Carrier as a Complex System
An insurance carrier is not merely a balance sheet or underwriting portfolio. It is a complex operating system that processes risk, capital, claims, workflows, decisions, personnel, technology, and market pressure.
Like all complex systems, an insurance carrier can occupy different temporal states.
A healthy system has options. It can absorb stress, recover from disruption, redirect resources, and correct course.
A compressed system has fewer options. It may still appear functional, but recovery windows shrink, interventions become less effective, and small disruptions create disproportionate consequences.
In insurance, temporal compression can develop beneath conventional indicators. The system may continue producing acceptable financial results while internal effort required to sustain those results increases. That is the distinction Time Engine measures.
3. Time Engine Variable Architecture
For insurance systems, the variable architecture can be organized into six categories. Four categories function as primary contextual drivers of system time: Energy, Entropy, Growth Phase, and Complexity. Operational Velocity serves as an observable indicator of system condition, while External Market and Economic Pressure provides environmental context. Together, these categories allow Time Engine to evaluate adaptive capacity, temporal compression, and recovery viability.
4. Enterprise Integration Architecture
Time Engine is designed to operate as an analytical layer above existing insurance systems rather than replacing them.
The framework utilizes operational telemetry that carriers already generate through claims, underwriting, policy administration, financial, customer service, and reinsurance workflows.
Representative data sources include:
• Claims management systems
• Policy administration platforms
• Underwriting systems
• Financial and accounting systems
• Customer service platforms
• Vendor management systems
• Reinsurance reporting systems
• Enterprise data warehouses
• Workflow and event logging platforms
Time Engine ingests operational events, state transitions, financial indicators, and system telemetry through standard reporting feeds, APIs, data warehouses, or enterprise integration layers.
No new sensors are required.
The objective is not to create additional operational reporting, but to transform existing telemetry into a temporal assessment of system condition.
Operational activity that appears unrelated in isolation can reveal a coherent temporal pattern when evaluated collectively.
Time Engine functions as a measurement layer that converts enterprise telemetry into assessments of adaptive capacity, temporal compression, intervention timing, and recovery viability.
Time Engine is designed to operate through existing reporting, warehouse, API, or event-stream architectures and can be deployed within established enterprise security, governance, and privacy frameworks. The platform does not require modification of core policy, claims, underwriting, or financial systems.
5. Normalization and Comparative Analysis
Insurance carriers operate across different lines of business, regulatory environments, geographic regions, and organizational scales.
A raw operational measurement rarely carries the same meaning across all systems.
For example, a forty-day claims cycle may indicate severe compression within a personal auto carrier while representing normal performance within a complex environmental liability portfolio.
Time Engine therefore evaluates system behavior relative to operating context rather than relying solely on absolute values.
Measurements are normalized against:
• Historical carrier performance
• Line-of-business benchmarks
• Geographic and regulatory conditions
• Organizational scale
• Portfolio composition
• Industry reference data
The objective is not to determine whether a metric is universally good or bad.
The objective is to determine whether the system is expanding adaptive capacity, preserving adaptive capacity, or consuming adaptive capacity relative to its own operating environment.
This allows temporal comparisons across carriers, business units, product lines, and time horizons without requiring identical operating structures.
6. System Energy Input and Stored Capacity
Energy represents the carrier’s capacity to perform work, absorb stress, and preserve optionality.
In insurance, energy is reflected in capital strength, liquidity, staffing capacity, operating cash flow, underwriting capacity, and the ability to fund corrective action.
Representative variables include:
Financial Energy
- Operating cash flow
- Free cash flow
- Operating cash flow margin
- Operating cash flow to net income
- Capital and surplus position
- Reserve strength
- Available credit capacity
- Debt service capacity
- Investment portfolio yield
- Reinsurance support availability
Operational Energy
- Claims staffing capacity
- Adjuster availability
- Underwriting capacity
- Technology system availability
- Workforce overtime capacity
- Management bandwidth
- Vendor capacity
- Call center or service capacity
Productive Output
- Policies bound
- Claims closed
- Backlog cleared
- Renewal volume processed
- Underwriting decisions completed
- Average cycle time improvement
- Settlement completion rate
Energy variables answer:
How much usable capacity does the carrier have available to respond?
A carrier with strong financial results but weakening operating cash flow, strained staffing, rising debt service, and deteriorating throughput may possess less usable time than its financial profile suggests.
7. Entropy and Capacity Consumption
If Energy represents a carrier’s ability to perform work, absorb stress, and preserve optionality, Entropy represents the forces that consume that capacity.
Within insurance systems, entropy appears as disorder, friction, rework, instability, and resource consumption that fail to produce proportional improvement. Entropy is not simply activity. A carrier may appear highly active while much of its effort is being consumed by maintaining order rather than creating value.
As entropy increases, larger amounts of capital, labor, and management attention are required to sustain the same level of operational output. In extreme cases, systems become trapped in a cycle where growing effort produces diminishing results.
Representative entropy variables include:
Claims Instability
- Reopened claim rate
- Reserve development drift
- Reserve adjustment frequency
- Claims severity trend slope
- Claims frequency volatility
- Litigation rate
- Supplemental claim frequency
- Claims escalation frequency
- Disputed claim percentage
Operational Friction
- Backlog growth
- SLA misses
- Rework rate
- Manual exception rate
- Complaint frequency
- Error correction frequency
- Escalation volume
- Duplicate handling
- Claims transferred between handlers
- Process exceptions
- Data correction frequency
- Manual overrides
- System reconciliation errors
- Failed automation rate
Financial and Organizational Drag
- Expense inflation
- Cost per claim growth
- Debt service burden
- Loss adjustment expense growth
- Reinsurance cost increase
- Vendor cost inflation
- Legal cost growth
- Vendor disputes
- Regulatory complaints
- Internal audit findings
Entropy variables answer:
How much of the carrier’s available capacity is being consumed by disorder, friction, instability, and non-productive effort?
This distinction is central to the Time Engine framework.
Not all activity is productive. Some activity advances the system. Some activity merely sustains the system. Some activity is consumed correcting, revisiting, escalating, reconciling, or managing disorder created elsewhere within the system.
Time Engine measures the degree to which available capacity is being converted into productive output versus being consumed by entropy.
A carrier may appear financially healthy while entropy quietly increases beneath the surface. As entropy rises, intervention becomes more difficult, recovery windows shrink, and temporal compression begins to emerge long before conventional indicators identify a problem.
8. Growth Phase and System Lifecycle
Growth phase identifies where the carrier sits in its lifecycle.
Growth can expand time when it increases capacity, revenue, market access, and optionality. But growth can also consume time when it increases complexity faster than the system can absorb it.
Representative variables include:
Expansion Signals
- Premium growth
- New business flow
- In-force policy count trend
- Agency appointments gained
- Geographic expansion
- Product launches
- New distribution channels
- Market share growth
Contraction Signals
- Cancellation rate
- Non-renewal rate
- Policy count decline
- Underwriting tightening
- Geographic market exits
- Reduced limits offered
- Coverage withdrawals
- Distribution partner losses
Growth Quality Signals
- Premium growth by profitability tier
- New business loss ratio
- Renewal retention quality
- Growth concentration by state or product
- Growth driven by pricing vs. exposure expansion
- Growth requiring disproportionate operational support
Growth phase variables answer:
Is the carrier expanding capacity, or merely expanding load?
This distinction matters. Premium growth alone does not indicate health. Growth that increases claims burden, underwriting complexity, regulatory exposure, and operational drag can accelerate compression rather than expand viability.
9. Complexity Load
Complexity measures how much coordination, decision-making, oversight, and internal translation are required for the system to function.
Moderate complexity can increase capability. Excessive complexity consumes energy and reduces response speed.
Representative variables include:
Workflow Complexity
- Touches per claim
- Handoffs per transaction
- Approval layers
- Manual review frequency
- Exception processing percentage
- Cross-department dependencies
- Reassignment frequency
- Settlement approval steps
Structural Complexity
- Product line count
- Jurisdiction count
- State regulatory variation
- Reinsurance layers
- Reinsurance counterparties
- Vendor count
- Technology platforms involved per workflow
- Policy administration systems involved
- Claims systems involved
- Data reconciliation requirements
Decision Drag
- Approval latency
- Settlement delay
- Policy change delay
- Underwriting referral delay
- Claims escalation delay
- Time to reserve adjustment
- Time to resolve exceptions
Complexity variables answer:
How much energy is required simply to keep the carrier functioning?
A carrier can become fragile not because it lacks activity, but because too much of its activity is consumed by coordination, exception handling, rework, and internal friction.
10. Operational Velocity
Operational velocity is one of the clearest observable indicators of a system’s temporal condition.
While Energy, Entropy, Growth Phase, and Complexity influence the underlying state of the carrier, velocity reveals how those forces are affecting the movement of work through the system.
Healthy systems typically maintain or improve velocity while preserving quality and stability. Compressed systems often require increasing effort to sustain the same throughput, resulting in slower cycle times, growing queues, and delayed response intervals.
Because Time Engine evaluates system time, changes in velocity provide an important signal regarding adaptive capacity, operational friction, and emerging compression.
Representative variables include:
Claims Velocity
- Average claims cycle time
- Median claims cycle time
- Time from FNOL to assignment
- Time from assignment to inspection
- Time from inspection to estimate
- Time from estimate to payment
- Time from reopening to resolution
- Time from reserve change to closure
- Time in litigation
- Time in subrogation
Underwriting Velocity
- Submission-to-quote time
- Quote-to-bind time
- Renewal processing time
- Referral processing time
- Time to approve endorsements
- Time to decline or non-renew
Operational Velocity
- Average task aging
- Queue dwell time
- Exception resolution time
- Approval latency
- Vendor response time
- Customer service response time
- Complaint resolution time
Velocity variables answer:
Is work moving through the system efficiently, slowing under load, or requiring increasing effort to achieve the same result?
A carrier experiencing declining velocity may not simply be becoming less efficient. It may be exhibiting the early effects of entropy accumulation, complexity growth, capacity constraints, or temporal compression.
11. External Market and Economic Pressure
Insurance carriers do not operate in isolation. Market conditions, economic forces, regulatory changes, and catastrophic events continuously influence system behavior.
External pressure does not automatically create temporal compression. Rather, it often exposes compression that already exists or accelerates conditions that are developing internally.
A resilient carrier can absorb significant external stress while maintaining adaptive capacity. A compressed carrier may experience disproportionate deterioration when exposed to the same conditions.
Representative variables include:
Industry Benchmarks
- Loss ratios by line and region
- Expense ratios by peer group
- Margin trends
- Reserve development trends
- Reinsurance rate movement
- Market capacity shifts
- Catastrophe exposure shifts
Economic Pressure
- Claims cost inflation
- Wage inflation
- Construction cost indices
- Material cost indices
- Medical cost trends
- Interest rate movement
- Legal cost trends
- Vehicle repair cost trends
- Replacement cost inflation
Market Stress
- Reinsurance pricing spikes
- Reduced limits offered
- Coverage withdrawals
- Regulatory pressure
- Competitive pricing pressure
- Adverse selection signals
- Distribution instability
External variables answer:
Are observed changes being driven primarily by internal system dynamics, external pressure, or an interaction of both?
This distinction is critical. Two carriers may experience identical market conditions while exhibiting dramatically different outcomes. Time Engine evaluates whether external forces are being absorbed by the system or whether those forces are exposing a reduction in adaptive capacity that was already present.
By separating external stress from internal compression, Time Engine helps distinguish temporary market disruption from deeper systemic deterioration.
12. Minimum Viable Pilot Dataset
A practical proof of concept does not require every variable within the Time Engine architecture.
The objective of a pilot is not to fully model the carrier, but to determine whether meaningful temporal signals emerge from a limited set of representative variables.
The minimum viable dataset should include measurements from each of the four primary contextual drivers: Energy, Entropy, Growth Phase, and Complexity.
Energy Variables
These variables measure available capacity and system resources.
- Operating cash flow
- Capital and surplus position
- Staffing capacity
- Claims per adjuster
- Expense run rate
Entropy Variables
These variables measure disorder, instability, friction, and rework.
- Reopened claim rate
- Reserve adjustment frequency
- Process exception rate
- Claims backlog
- Loss severity drift
Growth Phase Variables
These variables measure expansion, contraction, and lifecycle position.
- In-force policy count
- New business flow
- Cancellation rate
- Non-renewal rate
Complexity Variables
These variables measure coordination burden and operational drag.
- Touches per claim
- Number of claim handoffs
- Approval latency
- Claims transferred between handlers
Velocity Indicators
Velocity is not a primary driver of contextual time, but serves as an observable indicator of system condition.
- Average claims cycle time
- Time from FNOL to assignment
- Time from assignment to closure
External Reference Data
External variables provide environmental context and help distinguish internal compression from market-wide stress.
- Industry loss ratio trends
- Claims cost inflation index
- Reinsurance rate movement
- Regional claims severity trend
- Line-of-business profitability benchmarks
- Economic inflation indicators
This minimum dataset allows Time Engine to evaluate whether a carrier is preserving adaptive capacity, consuming adaptive capacity, or approaching a state where intervention becomes materially less effective.
13. Output Layer
Time Engine converts system telemetry into temporal assessments that support executive decision-making.
The objective is not to generate another collection of operational metrics, but to transform system behavior into a temporal understanding of viability, adaptability, and intervention effectiveness.
The output layer is organized into three levels: Temporal State Assessment, Diagnostic Outputs, and Decision Support Outputs.
Temporal State Assessment
These outputs describe the current condition of the system.
- Temporal State
- Time Compression Index
- Adaptive Capacity Trend
- Remaining Recovery Window
- Intervention Window
- Recovery Viability Assessment
These outputs answer:
- Is the system expanding, stable, or compressing?
- How much adaptive capacity remains?
- Is recovery becoming easier or more difficult?
- How much time remains before intervention effectiveness materially declines?
Diagnostic Outputs
These outputs identify the underlying drivers of temporal change.
- Compression Source Identification
- Entropy Contribution Analysis
- Complexity Burden Assessment
- Capacity Constraint Identification
- Growth Sustainability Assessment
- External Pressure Attribution
These outputs answer:
- What is creating compression?
- Which subsystems are consuming adaptive capacity?
- Is deterioration being driven by internal dynamics, external conditions, or both?
- Which factors are contributing most to loss of viability?
Decision Support Outputs
One objective of the framework is to determine whether additional investment is likely to restore adaptive capacity or be consumed by existing system constraints.
These outputs support strategic and operational decision-making.
- Capital Allocation Priority
- Intervention Priority Ranking
- Resource Deployment Recommendations
- Recovery Feasibility Assessment
- Irreversibility Risk Threshold
- Temporal Risk Classification
These outputs answer:
- Can the system still be stabilized?
- Is deterioration temporary or structural?
- Is capital likely to restore viability or be consumed by entropy?
- Should intervention occur now, later, or not at all?
- Is the system still insurable, reinsurable, investable, or recoverable?
The purpose of the output layer is not to predict a specific future event. The purpose is to measure the system’s remaining capacity to influence that future.
Traditional analytics focus on outcomes.
Time Engine focuses on viability.
14. Illustrative Carrier Comparison
Consider two property and casualty carriers that appear similar under conventional review.
Traditional Indicators
Carrier A
- Combined Ratio: 96
- Premium Growth: 5.2%
- Capital / Surplus Position: Strong
- Financial Rating: Comparable
- Market Share: Stable
Carrier B
- Combined Ratio: 97
- Premium Growth: 5.1%
- Capital / Surplus Position: Strong
- Financial Rating: Comparable
- Market Share: Stable
Based on traditional financial and actuarial indicators, both carriers appear to present similar risk profiles.
However, a temporal review of operating data reveals a different condition beneath the surface.
System Variables
Carrier A
- Operating Cash Flow to Net Income: 2.2x
- Operating Cash Flow Margin: 12–14%
- Debt Service Capacity: 8x
- Claims Backlog: 10
- Average Claims Cycle Time: 15 days
- Adjuster Capacity: Under capacity
- Claims per Adjuster: 150
- Touches per Claim: 5
- Reserve Adjustment Frequency: 2
- Reopened Claim Rate: 2%
- Loss Severity Drift: 4%
- Approval Latency: 24 hours
- Process Exceptions: 7%
- Product / State Complexity: Stable
- Reinsurance Cost Trend: Stable
- Cancellation / Non-Renewal Rate: Stable
Carrier B
- Operating Cash Flow to Net Income: 0.5x
- Operating Cash Flow Margin: 5%
- Debt Service Capacity: 4x
- Claims Backlog: 50
- Average Claims Cycle Time: 40+ days
- Adjuster Capacity: Over capacity
- Claims per Adjuster: 300
- Touches per Claim: 20
- Reserve Adjustment Frequency: 3
- Reopened Claim Rate: 5%
- Loss Severity Drift: 8%
- Approval Latency: 2 days
- Process Exceptions: 30%
- Product / State Complexity: Expanding
- Reinsurance Cost Trend: Increasing
- Cancellation / Non-Renewal Rate: Rising
Viewed individually, these variables may not appear catastrophic.
Viewed collectively, they reveal two systems moving in different temporal directions.
Carrier A is preserving adaptive capacity.
Carrier B is consuming adaptive capacity.
15. Temporal Assessment
Carrier A: Temporal Stability
Temporal State: Stable
Observed Trend: Sustainable
Intervention Window: OpenCarrier A remains temporally stable. Operating energy remains available. Claims activity is manageable. Staffing capacity remains proportional to system load. Process friction is low. Corrective actions continue producing measurable results.The organization retains enough adaptive capacity to absorb stress without materially reducing future viability.
Carrier B: Temporal Compression
Temporal State: Compression Detected
Observed Trend: Deteriorating
Intervention Window: NarrowingCarrier B is entering temporal compression. Although conventional financial indicators remain comparable to Carrier A, the underlying system is consuming increasing resources to maintain present performance.Claims require more touches. Cycle times are lengthening. Backlog is growing. Reserve adjustments are increasing. Reinsurance costs are rising. Process exceptions are elevated. Operational complexity is expanding.The carrier still appears functional, but its recovery capacity is contracting.
16. Discovery of Contextual Time
The Time Engine framework did not originate within insurance.The underlying concept emerged from observations across biological, technological, organizational, ecological, and economic systems that appeared unrelated yet exhibited remarkably similar patterns of growth, adaptation, stress, and decline.Across domains, systems that possessed available capacity, manageable complexity, and low internal friction consistently demonstrated longer recovery horizons and greater resilience.Systems experiencing increasing disorder, resource constraints, and complexity burden consistently exhibited shrinking recovery windows, reduced adaptability, and accelerated failure dynamics.These recurring observations suggested that many forms of collapse are preceded not merely by deteriorating performance, but by a reduction in the amount of usable time available to influence future outcomes.This observation became the foundation for Contextual Time Theory and ultimately the development of Time Engine.Insurance represents one practical application of the framework rather than its origin.The broader hypothesis is that temporal compression and adaptive capacity are measurable properties of complex systems regardless of domain.
17. The Unique Inference
Traditional insurance analytics primarily evaluate historical performance, profitability, known risk exposure, projected losses, and capital adequacy.
Time Engine evaluates something different:
the remaining temporal viability of the carrier itself.
The unique inference is not that Carrier B will fail.The unique inference is that Carrier B has less usable time remaining to correct course if current conditions persist. That distinction matters.A system can remain profitable while becoming less recoverable.A system can maintain capital strength while losing operational maneuverability.A system can appear stable while its intervention window is closing.Time Engine is designed to identify that condition.
18. Complementing Traditional Actuarial Models
Time Engine is not intended to replace actuarial science, catastrophe modeling, reserve analysis, pricing models, or capital adequacy frameworks. Those disciplines remain essential to understanding insurance risk.
Time Engine addresses a different question.Traditional actuarial models evaluate exposure, probability, loss development, reserve adequacy, pricing sufficiency, and financial performance.
Time Engine evaluates the condition of the operating system responsible for managing those risks.
Traditional analytics help answer:
• Is risk understood?
• Is risk appropriately priced?
• Is capital adequate?
• Are reserves sufficient?
Time Engine helps answer:
• Is adaptive capacity increasing or declining?
• Is the carrier preserving or consuming future recoverability?
• How much intervention time remains?
• Which operating functions are creating temporal compression?
Rather than competing with traditional insurance analytics, Time Engine is designed to complement them.The framework provides an additional layer of visibility into system viability, helping leadership determine whether favorable financial results are being achieved through sustainable operating conditions or through the consumption of future adaptive capacity.
Traditional models evaluate risk.
Time Engine evaluates the system managing that risk.
19. Why This Is Not Just Another Dashboard
Most insurance dashboards organize known metrics. Time Engine interprets system condition.A dashboard may show:
- Claims are taking longer.
- Backlog is rising.
- Reopened claims are increasing.
- Expenses are increasing.
- Reinsurance costs are rising.
Time Engine evaluates whether those signals are interacting in a way that reduces the carrier’s future ability to respond.That is the difference between performance monitoring and temporal measurement.Performance monitoring tells leadership what is changing.Temporal measurement tells leadership whether the system still has time to adapt.
20. Strategic ApplicationsEnterprise Risk Monitoring
Time Engine can help identify operational fragility before it appears as loss-ratio deterioration, capital strain, or rating pressure.
Reinsurance Risk Assessment
Reinsurers can evaluate not only historical loss performance but the operating condition of the primary carrier itself. A carrier with similar financial results but declining adaptive capacity may represent a materially different reinsurance risk.
Claims Operations
Time Engine can identify whether claim handling systems are stabilizing, deteriorating, or consuming increasing effort for decreasing improvement.
Capital Allocation
Capital is not equally useful in every temporal state. In an expanding or stable system, capital can increase future option value. In a compressed system, capital may be consumed by entropy, backlog, rework, complexity, or operating drag.Time Engine helps determine whether capital is likely to restore viability or become trapped inside a deteriorating system.
Intervention Prioritization
Leadership can focus intervention where adaptive capacity is being consumed fastest.
This shifts the question from:
Where are metrics bad?
to:
Where is the system running out of usable time?
M&A and Integration Risk
During acquisitions, Time Engine can evaluate whether combined systems are gaining efficiency or entering compression through added complexity, workflow disruption, staffing strain, technology misalignment, or integration drag.
21. Commercial Importance
The commercial value of Time Engine is not simply earlier warning. The value is earlier warning with context. A carrier does not need another signal that something is wrong. Time Engine helps organizations avoid allocating capital to systems that are no longer capable of converting investment into durable improvement.It needs to know:
- whether intervention is still likely to work,
- where adaptive capacity is being consumed,
- which operating units are creating compression,
- whether deterioration is temporary or structural,
- how quickly the window for correction is closing,
- and whether capital can still change the outcome.
This creates a different category of insurance intelligence.Not prediction alone.Not risk scoring alone.Not performance reporting alone.
Temporal viability measurement.
22. Conclusion
Insurance companies do not fail only because risk was mispriced.They also fail because internal systems lose the capacity to respond before traditional indicators recognize the deterioration.Time Engine Technologies provides a framework for evaluating that hidden condition.By measuring temporal compression, adaptive capacity, intervention windows, and recovery viability, Time Engine creates a new way to evaluate insurance carriers as complex systems.
The question is no longer only:
What happened? or What may happen?
The more important question is:
How much usable time remains to change the outcome?
This paper is illustrative and presented to demonstrate how Time Engine can be applied within insurance and reinsurance systems. Validation against real-world carrier data remains an ongoing area of development.
Author
Chris Olson Founder & CEO Time Engine Technologies LLC
Suggested Citation
Olson, C. (2026). Adaptive Capacity Measurement for Insurance and Reinsurance Systems: A Temporal Framework for Detecting Compression, Intervention Windows, and Capital Allocation Risk. Time Engine Technologies LLC.
Time Engine™, Contextual Time, and related methodologies described herein are proprietary intellectual property of Time Engine Technologies LLC. Certain implementation methods, algorithms, normalization procedures, and processing architectures are proprietary, patent pending, or intentionally withheld from publication.
© 2026 Time Engine Technologies LLC. All rights reserved.
Contact Time Engine Technologies LLC
Contextual Time and the Time Engine™ were developed by Chris Olson, Founder & CEO of
Time Engine Technologies LLC
2800 University Ave ste 245, West Des Moines, IA, USA
